深層学習の学習 【その3】[追記]
[追記]
便利参考サイトを追記しました
概要
以前は下記記事のようにTensorflowで深層学習について学ぶ予定でしたが、やはり基礎も抑えておかないと応用するときに立ち往生すると思うので、少し違ったアプローチで学習します。
【記事1】
kuroyagi.hatenablog.com
今回は以下をやってみます。
【記事2】
qiita.com
そこそこpythonの心得がないと例のサンプルコードが実行出来ません。いろいろといらべて動くようになったので、その点を補った手順を示します。ちなみに、【記事3】も併せて見ると基本的なところまでカバーできると思います。
【記事3】
qiita.com
実践
【記事2】の内容を噛み砕いて進めていきます。ちなみに環境は以下の通りです。
OS: windows7 64bit
Python: 3.6.1
1.準備
仮想環境として今回はDeepというフォルダを作りました。方法は以下の通り
py -3 -m venv Deep
今回必要なパッケージは以下の通り
・matplotlib
・numpy
・scipy
・sklearn
・chainer
以上をpipを使って仮想環境にインストールしておきましょう。尚、numpy、scipyはインストール方法が特殊なので以下の【記事4】にあるその他ライブラリの項目を参考にしてインストールして下さい。
【記事4】
kuroyagi.hatenablog.com
2.データの生成と描画
【記事2】に倣って先ずは解析するデータを生成します以下の【ソースコード1】で動くはずです。
【ソースコード1】
import numpy as np
import sklearn.datasets
import matplotlib
import matplotlib.pyplot as plt


np.random.seed(0)
X,y=sklearn.datasets.make_moons(200,noise=0.20)
plt.scatter(X[:,0], X[:,1], s=40, c=y, cmap=plt.cm.Spectral)

plt.show()
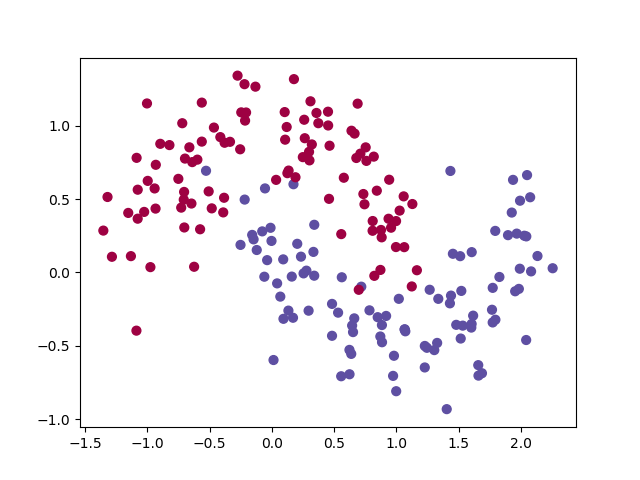
結果はこんな感じです。
【画像1】

3.ロジスティクス回帰モデル
お次はロジスティクス回帰モデルを学習させます。
【ソースコード2】
import numpy as np
import sklearn.datasets
import sklearn.linear_model
import matplotlib
import matplotlib.pyplot as plt


np.random.seed(0)
X,y=sklearn.datasets.make_moons(200,noise=0.20)
plt.scatter(X[:,0], X[:,1], s=40, c=y, cmap=plt.cm.Spectral)

# ロジスティック回帰モデルを学習させる
clf = sklearn.linear_model.LogisticRegressionCV()
clf.fit(X, y)

def plot_decision_boundary(pred_func):
    # Set min and max values and give it some padding
    x_min, x_max = X[:, 0].min() - .5, X[:, 0].max() + .5
    y_min, y_max = X[:, 1].min() - .5, X[:, 1].max() + .5
    h = 0.01
    # Generate a grid of points with distance h between them
    xx, yy = np.meshgrid(np.arange(x_min, x_max, h), np.arange(y_min, y_max, h))
    # Predict the function value for the whole gid
    Z = pred_func(np.c_[xx.ravel(), yy.ravel()])
    Z = Z.reshape(xx.shape)
    # Plot the contour and training examples
    plt.contourf(xx, yy, Z, cmap=plt.cm.Spectral)
    plt.scatter(X[:, 0], X[:, 1], c=y, cmap=plt.cm.Spectral)

# 決定境界をプロットする
plot_decision_boundary(lambda x: clf.predict(x))
plt.title("Logistic Regression")

plt.show()
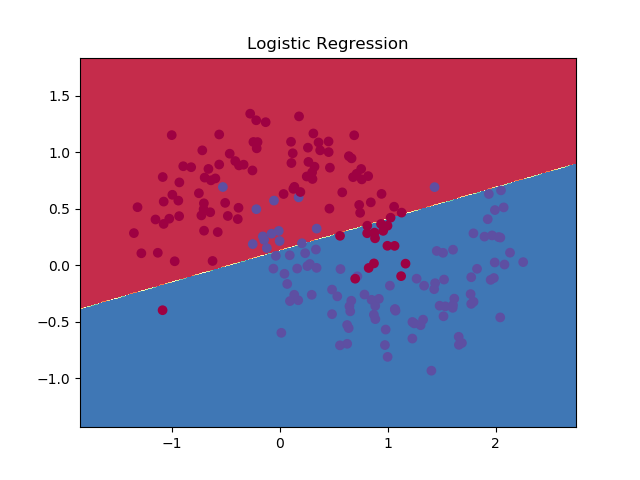
結果はこんな感じです。
【画像2】

注意点
・plot_decision_boundaryは標準関数ではないからソースコード内で定義
4.ニューラルネットワーク
【ソースコード3】
import numpy as np
import sklearn.datasets
import sklearn.linear_model
import matplotlib
import matplotlib.pyplot as plt


np.random.seed(0)
X,y=sklearn.datasets.make_moons(200,noise=0.20)
plt.scatter(X[:,0], X[:,1], s=40, c=y, cmap=plt.cm.Spectral)

# ロジスティック回帰モデルを学習させる
clf = sklearn.linear_model.LogisticRegressionCV()
clf.fit(X, y)

def plot_decision_boundary(pred_func):
    # Set min and max values and give it some padding
    x_min, x_max = X[:, 0].min() - .5, X[:, 0].max() + .5
    y_min, y_max = X[:, 1].min() - .5, X[:, 1].max() + .5
    h = 0.01
    # Generate a grid of points with distance h between them
    xx, yy = np.meshgrid(np.arange(x_min, x_max, h), np.arange(y_min, y_max, h))
    # Predict the function value for the whole gid
    Z = pred_func(np.c_[xx.ravel(), yy.ravel()])
    Z = Z.reshape(xx.shape)
    # Plot the contour and training examples
    plt.contourf(xx, yy, Z, cmap=plt.cm.Spectral)
    plt.scatter(X[:, 0], X[:, 1], c=y, cmap=plt.cm.Spectral)

# 決定境界をプロットする
plot_decision_boundary(lambda x: clf.predict(x))
plt.title("Logistic Regression")


num_examples = len(X) # 学習用データサイズ
nn_input_dim = 2 # インプット層の次元数
nn_output_dim = 2 # アウトプット層の次元数

# Gradient descent parameters (数値は一般的に使われる値を採用)
epsilon = 0.01 # gradient descentの学習率
reg_lambda = 0.01 # regularizationの強さ


# 全Lossを計算するためのHelper function
def calculate_loss(model):
    W1, b1, W2, b2 = model['W1'], model['b1'], model['W2'], model['b2']
    # 予測を算出するためのForward propagation
    z1 = X.dot(W1) + b1
    a1 = np.tanh(z1)
    z2 = a1.dot(W2) + b2
    exp_scores = np.exp(z2)
    probs = exp_scores / np.sum(exp_scores, axis=1, keepdims=True)
    # Lossを計算
    corect_logprobs = -np.log(probs[range(num_examples), y])
    data_loss = np.sum(corect_logprobs)
    # Lossにregulatization termを与える (optional)
    data_loss += reg_lambda/2 * (np.sum(np.square(W1)) + np.sum(np.square(W2)))
    return 1./num_examples * data_loss


# Helper function to predict an output (0 or 1)
def predict(model, x):
    W1, b1, W2, b2 = model['W1'], model['b1'], model['W2'], model['b2']
    # Forward propagation
    z1 = x.dot(W1) + b1
    a1 = np.tanh(z1)
    z2 = a1.dot(W2) + b2
    exp_scores = np.exp(z2)
    probs = exp_scores / np.sum(exp_scores, axis=1, keepdims=True)
    return np.argmax(probs, axis=1)


# This function learns parameters for the neural network and returns the model.
# - nn_hdim: Number of nodes in the hidden layer
# - num_passes: Number of passes through the training data for gradient descent
# - print_loss: If True, print the loss every 1000 iterations
def build_model(nn_hdim, num_passes=20000, print_loss=False):

    # Initialize the parameters to random values. We need to learn these.
    np.random.seed(0)
    W1 = np.random.randn(nn_input_dim, nn_hdim) / np.sqrt(nn_input_dim)
    b1 = np.zeros((1, nn_hdim))
    W2 = np.random.randn(nn_hdim, nn_output_dim) / np.sqrt(nn_hdim)
    b2 = np.zeros((1, nn_output_dim))

    # This is what we return at the end
    model = {}

    # Gradient descent. For each batch...
    for i in range(0, num_passes):

        # Forward propagation
        z1 = X.dot(W1) + b1
        a1 = np.tanh(z1)
        z2 = a1.dot(W2) + b2
        exp_scores = np.exp(z2)
        probs = exp_scores / np.sum(exp_scores, axis=1, keepdims=True)

        # Backpropagation
        delta3 = probs
        delta3[range(num_examples), y] -= 1
        dW2 = (a1.T).dot(delta3)
        db2 = np.sum(delta3, axis=0, keepdims=True)
        delta2 = delta3.dot(W2.T) * (1 - np.power(a1, 2))
        dW1 = np.dot(X.T, delta2)
        db1 = np.sum(delta2, axis=0)

        # Add regularization terms (b1 and b2 don't have regularization terms)
        dW2 += reg_lambda * W2
        dW1 += reg_lambda * W1

        # Gradient descent parameter update
        W1 += -epsilon * dW1
        b1 += -epsilon * db1
        W2 += -epsilon * dW2
        b2 += -epsilon * db2

        # Assign new parameters to the model
        model = { 'W1': W1, 'b1': b1, 'W2': W2, 'b2': b2}

        # Optionally print the loss.
        # This is expensive because it uses the whole dataset, so we don't want to do it too often.
        if print_loss and i % 1000 == 0:
          print ("Loss after iteration %i: %f" %(i, calculate_loss(model)))

    return model


# 3次元の隠れ層を持つモデルを構築
model = build_model(3, print_loss=True)

# 決定境界をプロットする
plot_decision_boundary(lambda x: predict(model, x))
plt.title("Decision Boundary for hidden layer size 3")


plt.show()
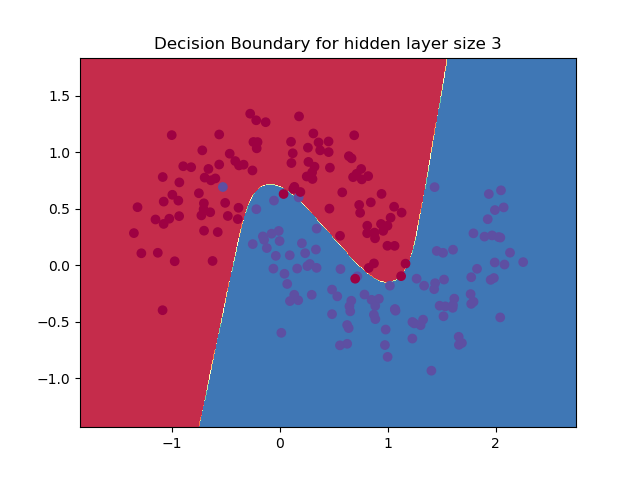
結果は以下の通り。
Loss after iteration 0: 0.432387
Loss after iteration 1000: 0.068947
Loss after iteration 2000: 0.068890
Loss after iteration 3000: 0.071218
Loss after iteration 4000: 0.071253
Loss after iteration 5000: 0.071278
Loss after iteration 6000: 0.071293
Loss after iteration 7000: 0.071303
Loss after iteration 8000: 0.071308
Loss after iteration 9000: 0.071312
Loss after iteration 10000: 0.071314
Loss after iteration 11000: 0.071315
Loss after iteration 12000: 0.071315
Loss after iteration 13000: 0.071316
Loss after iteration 14000: 0.071316
Loss after iteration 15000: 0.071316
Loss after iteration 16000: 0.071316
Loss after iteration 17000: 0.071316
Loss after iteration 18000: 0.071316
Loss after iteration 19000: 0.071316
【画像3】

注意点
・python3系ではxrangeが削除されているのでxrange=>rangeに修正
まとめ
何とかできました!
内容は薄っすらしか分かりませんが、何回か読み直しつつソースコードを眺めつつ復習したいと思います。
以下過去記事です。
深層学習の学習【その1】[追記] - Kuroyagi飼育日誌
深層学習の学習【その2】[追記] - Kuroyagi飼育日誌